#!/bin/bash -xe
exec > >(tee /var/log/user-data.log|logger -t user-data -s 2>/dev/console) 2>&1sleep 15
systemctl restart sshd
sudo systemctl restart sshd
sleep 15
netstat -tupln
systemctl status sshd
#!/bin/bash -xe
exec > >(tee /var/log/user-data.log|logger -t user-data -s 2>/dev/console) 2>&1Network configuration and troubleshooting are the essential part of Linux administration. Even for a developer who works with Linux Systems, knowledge about Linux networking commands is an added advantage.
Specifically, if you are in DevOps or SRE domain, it is essential to know all the Linux troubleshooting commands as they will be part of your day-to-day activities.
This post will cover the important networking and troubleshooting commands that are natively available in the Linux systems.
Following is the list of natively available troubleshooting commands.
| Command | Description |
hostname | To check and set the hostname of the server. |
host | To get host DNS details |
ping | Checks if the remote server is reachable using ICMP protocol. It also shows the round trip time of packets. |
curl | A cross-platform utility that is used to transfer data. It can be used for troubleshooting several network issues. |
wget | Utility to download files. Can be used for troubleshooting proxy connections and connectivity. |
ip | A replacement for ifconfig. Can be used to configure and retrieve information about systems network interfaces |
arp | Utility to view and manage arp cache. |
ss/netstat | Primarily used to check the connections and PID on ports and Unix sockets. |
traceroute | This utility uses the ICMP protocol and finds the hops involved in reading the destination server. It also shows the time it takes between hops. |
mtr | mtr is a mix of ping and traceroute. It also provides additional information like intermediate hosts and responsiveness. |
dig | Helps you get the DNS records associated with a domain name. |
nslookup | Command similar to dig. |
nc | utility to debug TCP/UDP sockets. |
telnet | It can be used to test remote connectivity on ports |
route | Helps you get all the route table information |
tcpdump | This utility helps you to capture network packets and analyze them for network issues. |
Let’s understand each command and see how we can use it to troubleshoot Linux.
Important Note: Every command/utility mentioned in this post has many options and flags. Every command has a man page and you can use it to identify the flags and options that are required for your use case. For example, for
ipcommand, you can just type itman ipin the terminal to get all the details about that command.
Hostname command is used to view the hostname of the machine and to set the hostname.
hostname
You can use the hostname command to set a new hostname for the machine. For example,
sudo hostname temp.com
If you set the hostname using “hostname” command, when you restart the machine, the hostname will change to the name specified in the hostname file ( eg: /etc/hostname).
So if you want to change the hostname permanently, you can use the /etc/hosts file or relevant hostname file present on the server.
/etc/hostname file./etc/sysconfig/network file.Also read: List of Linux Commands Every Developer Should Know
Host command is for the reverse lookup of IP or a DNS name.
For example, If you want to find a DNS attached with an IP you can use the host commands as follows.
host 8.8.8.8You can also do the reverse to find the IP address associated with the domain name. For example,
host devopscube.comThe ping networking utility is used to check if the remote server is reachable or not. It is primarily used for checking the connectivity and troubleshooting network.
It provides the following details.
Ping command has the following syntax.
ping <IP or DNS>
For example,
ping devopscube.comTo ping IP address
ping 8.8.8.8If you want to limit the ping output without using ctrl+c, then you can use the “-c” flag with a number as shown below.
ping -c 1 devopscube.comCurl utility is primarily used to transfer data from or to a server. However, you can use it for network troubleshooting.
For network troubleshooting, curl supports protocols such as DICT, FILE, FTP, FTPS, GOPHER, HTTP, HTTPS, IMAP, IMAPS, LDAP, LDAPS, MQTT, POP3, POP3S, RTMP, RTMPS, RTSP, SCP, SFTP, SMB, SMBS, SMTP, SMTPS, TELNET and TFTP
For example, curl can check connectivity on port 22 using telnet.
curl -v telnet://192.168.33.10:22You can check the FTP connectivity using curl.
curl ftp://ftptest.net You can troubleshoot web server connectivity as well.
curl http://devopscube.com -IThe wget command is primarily used to fetch web pages.
You can use wget to troubleshoot network issues as well.
For example, you can troubleshoot proxy server connections using wget.
wget -e use_proxy=yes http_proxy=<proxy_host:port> http://externalsite.comYou can check if a website is up by fething the files.
wget www.google.comip command is used to display and manipulate routes and network interfaces. ip command is the newer version of ifconfig. ifconfig works in all the systems, but it is better to use ip command instead of ifconfig.
Let’s have a look at few examples of ip command.
ip addr
You can use this command with pipes and grep to get more granular output like the IP address of the eth0 interface. It is very useful when you work on automation tools that require IP to be fetched dynamically.
The following command gets the IP address of eth0 network interface.
ip a | grep eth0 | grep "inet" | awk -F" " '{print $2}'Get details of a specific interface
ip a show eth0
You can list the routing tables.
ip route
ip route listARP (Address Resolution Protocol) shows the cache table of local networks’ IP addresses and MAC addresses that the system interacted with.
arpExample output,
vagrant@dcubelab:~$ arp
Address                  HWtype  HWaddress           Flags Mask            Iface
10.0.2.3                 ether   52:54:00:12:35:03   C                     eth0
192.168.33.1             ether   0a:00:27:00:00:00   C                     eth1
10.0.2.2 ether 52:54:00:12:35:02 C eth0The ss command is a replacement for netstat. You can still use the netstat command on all systems.
Using ss command, you can get more information than netstat command. ss command is fast because it gets all the information from the kernel userspace.
Now let’s have a look at few usages of ss command.
The “ss” command will list all the TCP, UDP, and Unix socket connections on your machine.
ubuntu@devopscube:~$ ss
Netid  State      Recv-Q Send-Q   Local Address:Port       Peer Address:Port
u_str  ESTAB      0      0                    * 7594                  * 0
u_str  ESTAB      0      0      @/com/ubuntu/upstart 7605                  * 0
u_str  ESTAB      0      0                    * 29701                 * 0
u_str  ESTAB      0      0      /var/run/dbus/system_bus_socket 29702                 * 0
tcp    ESTAB      0      400      172.31.18.184:ssh         1.22.167.31:61808
The output of the ss command will be big so you can use ” ss | less ” command to make the output scrollable.
If you want to filter out TCP , UDP or UNIX socket details, use “-t” “-u” and “-x” flag with the “ss” command. It will show all the established connections to the specific ports. If you want to list both connected and listening ports using “a” with the specific flag as shown below.
ss -ta
ss -ua
ss -xa
To list all the listening ports, use “-l” flag with ss command. To list specific TCP, UDP or UNIX socket, use “-t”, “-u” and “-x” flag with “-l” as shown below.
ubuntu@devopscube:~$ ss -lt
State      Recv-Q Send-Q      Local Address:Port          Peer Address:Port
LISTEN     0      128                     *:ssh                      *:*
LISTEN     0      50                     :::http-alt                 :::*
LISTEN     0      50                     :::55857                   :::*
LISTEN     0      128                    :::ssh                     :::*
LISTEN     0      50                     :::53285                   :::*
ubuntu@devopscube:~$
To list all the established ports, use the state established flag as shown below.
ss -t -r state establishedTo list all sockets in listening state,
ss -t -r state listeningIf you do not have a traceroute utility in your system or server, you can install it from the native repository.
traceroute is a network troubleshooting utility. Using traceroute you can find the number of hops required for a particular packet to reach the destination.
For example,
traceroute google.comHere is the output.
traceroute to google.com (173.194.33.163), 30 hops max, 60 byte packets
 1  ec2-50-112-0-84.us-west-2.compute.amazonaws.com (50.112.0.84)  1.974 ms  1.895 ms  1.899 ms
 2  100.64.1.247 (100.64.1.247)  1.414 ms 100.64.1.137 (100.64.1.137)  1.127 ms 100.64.1.97 (100.64.1.97)  1.313 ms
 3  100.64.0.198 (100.64.0.198)  1.443 ms 100.64.0.62 (100.64.0.62)  2.160 ms 100.64.0.60 (100.64.0.60)  2.116 ms
10  66.249.94.214 (66.249.94.214)  6.313 ms  7.104 ms 209.85.249.34 (209.85.249.34)  5.986 ms
11  209.85.244.65 (209.85.244.65)  6.157 ms  6.341 ms  6.574 m.
.
12  sea09s18-in-f3.1e100.net (173.194.33.163)  6.302 ms  6.517 ms  6.071 ms
ubuntu@devopscube:~$
The above output shows the hop count (12) to reach google.com from devopscube AWS ec2 server.
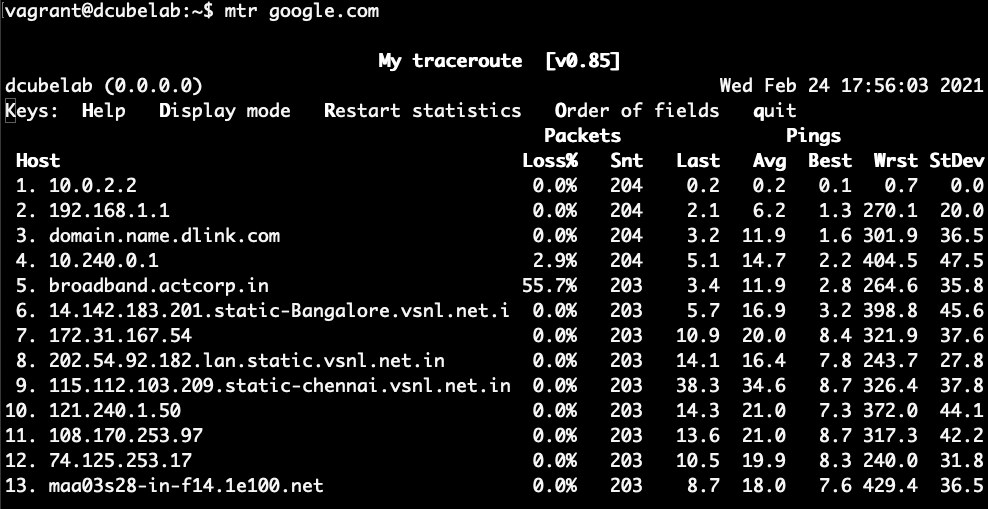
The mtr utility is a network diagnostic tool to troubleshoot the network bottlenecks. It combines the functionality of both ping and traceroute
For example, the following command shows the traceroute output in real-time.
mtr google.comHere is the output.
You can generate a report using the –report flag. When you run the mtr report, it sends 10 packets to the destination and creates the report.
mtr -n --report google.com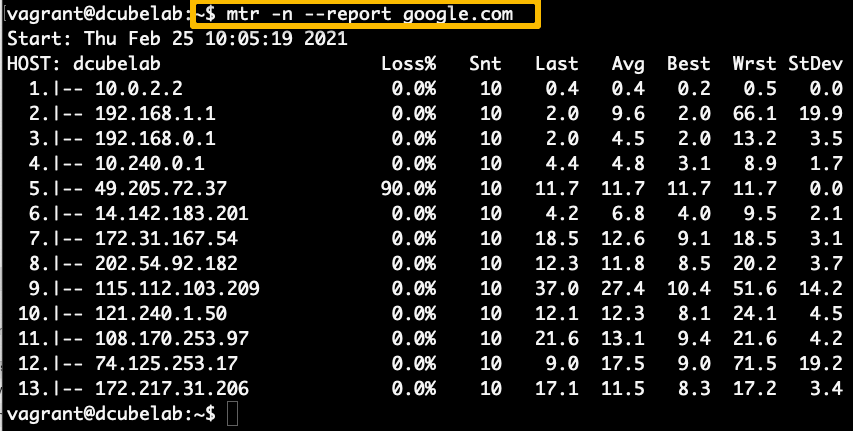
If you have any task related to DNS lookup, you can use “dig” command to query the DNS name servers.
The following command returns all the DNS records and TTL information of a twitter.com
dig twiter.com ANY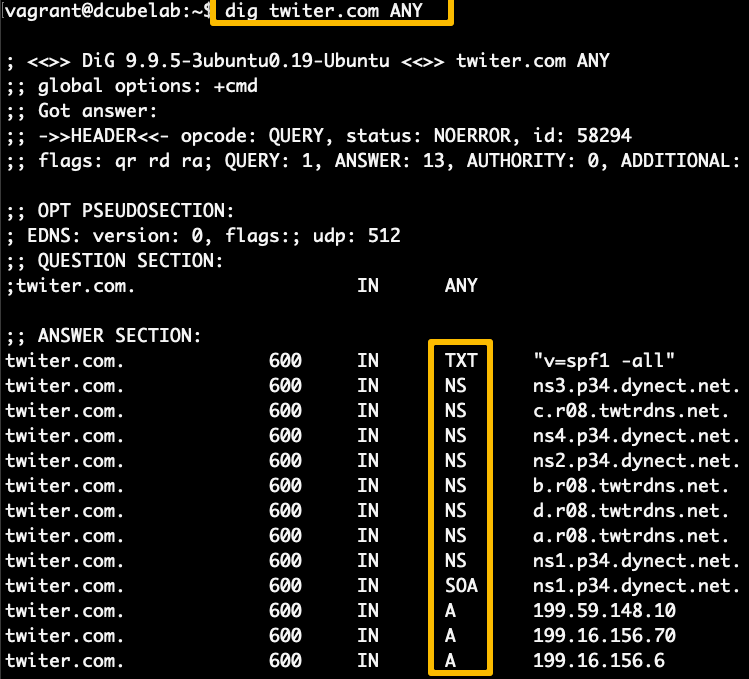
Use +short to get the output without verbose.
dig google.com ANY +shortFor example, If you want to get the A record for the particular domain name, you can use the dig command. +short will provide the information without verbose
dig www.google.com A +shortSimilarly, you can get the other record information separately using the following commands.
dig google.com CNAME +short
dig google.com MX +short
dig google.com TXT +short
dig google.com NS +short
Nslookup (Name Server Lookup) utility is used to check the DNS entries. It is similar to dig command.
To check the DNS records of a domain, you can use the following command.
nslookup google.comYou can also do a reverse lookup with the IP address.
nslookup 8.8.8.8To get all the DNS records of a domain name, you can use the following.
nslookup -type=any google.comSimilarly, you can query for records like mx, soa etc
The nc (netcat) command is known as the swiss army of networking commands.
Using nc, you can check the connectivity of a service running on a specific port.
For example, to check if ssh port if open, you can use the following command.
nc -v -n 192.168.33.10 22netcat can also be used for data transfer over TCP/UDP and port scanning.
Port scanning is not recommended in cloud environments. You need to request the cloud provider to perform port scanning operations in your enviroment.
The telnet command is used to troubleshoot the TCP connections on a port.
To check port connectivity using telnet, use the following command.
telnet 10.4.5.5 22The “route” command is used to get the details of the route table for your system and to manipulate it. Let us look at few examples for the route command.
Execute the “route” command without any arguments to list all the existing routes in your system or server.
ubuntu@devopscube:~$ route
Kernel IP routing table
Destination     Gateway         Genmask         Flags Metric Ref    Use Iface
default         ip-172-31-16-1. 0.0.0.0         UG    0      0        0 eth0
172.17.0.0      *               255.255.0.0     U     0      0        0 docker0
172.31.16.0     *               255.255.240.0   U     0      0        0 eth0
ubuntu@devopscube:~$
If you want to get the full output in numerical form without any hostname, you can use “-n” flag with the route command.
ubuntu@devopscube:~$ route -n
Kernel IP routing table
Destination     Gateway         Genmask         Flags Metric Ref    Use Iface
0.0.0.0         172.31.16.1     0.0.0.0         UG    0      0        0 eth0
172.17.0.0      0.0.0.0         255.255.0.0     U     0      0        0 docker0
172.31.16.0     0.0.0.0         255.255.240.0   U     0      0        0 eth0
ubuntu@devopscube:~$
If you think we missed any important command, let us know in the comments section.
The tcpdump command is primarily used for troubleshooting network traffic.
Note: To analyze the output of
tcpdumpcommand requires some learning, so explaining it is out of the scope of this article.
tcpdump command works with the network interfaces of the system. So you need to use administrative privileges to execute the command.
Use the following command to list all the interfaces.
sudo tcpdump --list-interfacesTo get the dump of packets on a specific interface, you can use the following command.
Note: press
ctrl + cto stop capturing the packets.
sudo tcpdump -i eth0To limit the packet capturing, you can use the -c flag with the number.
For example,
sudo tcpdump -i eth0 -c 10To capture packets on all the interfaces, use the any flag as shown below.
sudo tcpdump -i anyThere are more networking troubleshooting command-line utilities available from third-party solutions.
You need to install them separately and use them for your troubleshooting purposes. Not every company will allow you to do it. However, if you have to option to use third-party tools, you can explore them.
In this article, we have covered the important Linux command-line utilities for network troubleshooting and configuration.
If you are getting started with system administration, DevOps, or SRE roles, it is essential to learn about these utilities to support the projects you are working on.
Each utility has many functionalities, and you can explore further to meet your requirements